

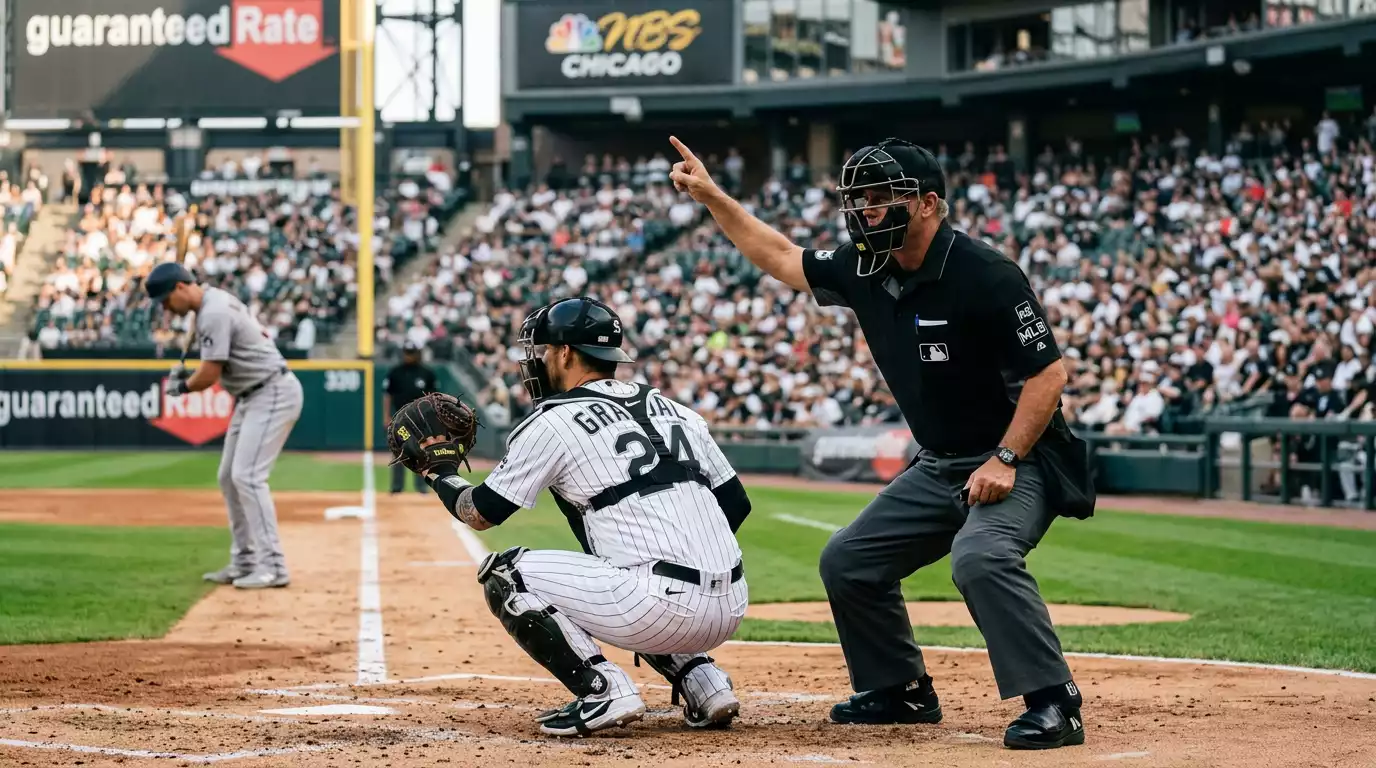
The umpire is a third pitcher
The home-plate umpire is the one official with the power to systematically nudge run scoring across an entire game. Not by the calls people argue about on TV – by the cumulative effect of where his strike zone sits, pitch by pitch, for nine innings. After a decade of tracking this, I treat the home-plate ump as the third pitcher in the game. Once you start pricing him into your model, you stop seeing umpire-driven results as bad luck and start seeing them as a market input the books underweight.
This is not a soft narrative. The umpire’s strike zone sets the trade-off between balls in play and at-bats that end on strikeouts and walks. A wide zone produces more called strikes, more pitcher confidence, fewer walks, more first-pitch swings, more weak contact, fewer extra-base hits. A tight zone produces the opposite. Either way the totals number moves – and most UK retail books are slow to integrate ump assignments into their pre-game pricing.
How the called strike zone moves totals
The mechanism is simple. A pitch on the corner that an under-leaning umpire calls a strike is the same pitch that a hitter-friendly umpire calls a ball. The hitter who gets that strike is now in a worse count, more likely to swing at the next pitch, more likely to roll over for a weak ground ball, more likely to strike out. Multiply that by 250 to 300 pitches in a typical game and you start to see the cumulative effect.
The 2025 average MLB game time was 2 hours 38 minutes – fast by historical standards because of the pitch clock. That tells you the game is more pitch-efficient than it used to be, which means each individual called strike or ball carries more relative weight in shaping the at-bat. A one-pitch swing in a faster game has more leverage on outcome than the same swing in a slower one. The ump has not lost influence, the influence has concentrated.
UK books that price MLB totals from a base assumption of league-average umpiring miss the tails. An ump running consistently wide zones is worth 0.3 to 0.5 runs of suppression on a typical total. That is the difference between an over and a push, or a push and a winning under. Find the tails, you find the bet.
Specific profiles: Kulpa and other under-leaning umps
Ron Kulpa is the textbook case. His unders record across recent seasons reads 254-190-25 – a 57.2% win rate on unders, with a +46.75-unit return and a 10% ROI. That is not a noise-level result. That is a multi-year persistent pattern, generated by a single umpire’s strike zone tendencies, that has paid out at unit return more reliably than most full-blown systems.
The reason Kulpa shows up in the data is that his zone has measurably more called strikes per nine innings than the league average, particularly on the low and outer edges. That converts at-bats into strikeouts, suppresses extra-base contact, and pulls scoring down. The market has known about it for years and still has not fully priced it in – partly because the average UK retail bettor does not check ump assignments, and partly because the soft-line books cannot adjust their main number without exposing themselves to the rest of the model.
Kulpa is not the only profile worth knowing. Tighter-zone umpires – and there are several whose zones consistently produce more walks and more runs – are the inverse. They are the over-leaning profiles. The principle is the same: the umpire’s measured zone is a stable, persistent input. If your model treats every game as if it has a league-average ump, you are leaving units on the table on both sides of the totals market.
I keep a rolling six-month spreadsheet on every active home-plate umpire – strike-zone tendency by zone, called-strike rate above and below average, and the running over/under record on their assigned games. It is not a glamorous spreadsheet, and it does not generate clickable picks every day. But over a 162-game season it produces 15 to 25 high-confidence under bets where the umpire profile lines up with pitcher-friendly conditions. Those are the bets I would not place without the umpire input.
ABS challenge system, pitch clock and 2025 changes
The ABS challenge system – an automated ball-strike system that allows a limited number of pitch reviews per game – was a structural change to how the umpire’s zone interacts with the at-bat. The 2025 implementation was limited and game-time effects on totals were modest in the first season of full deployment, but the system changes the long-term ump-edge calculus. If a hitter can challenge a borderline strike, the wide-zone umpire loses some of his asymmetric impact on the game.
The pitch clock added another wrinkle. It reduced average game time by roughly 25 minutes from pre-2023 levels and concentrated each at-bat into a shorter sequence. With 2 hours 38 minutes as the 2025 baseline, the umpire is making decisions faster, the catcher is framing faster, and the recovery time between pitches is shorter. In theory that increases umpire variance – a tired or distracted ump in the seventh inning is making faster decisions than ever. In practice the data has not yet shown a major shift in the under-leaning profiles’ efficacy. They still work.
The directional read for a UK bettor is straightforward. The systemic ump edge is not gone, but it is being chipped at by automation and by faster game pacing. I expect within three years the wide-zone-under edge will narrow, particularly if ABS expands to more pitch reviews per game. The window to capture this edge cleanly is now and the next two seasons.
Where UK bettors can find umpire data
UK bettors have to do more work than US-based ones to find umpire assignments. The MLB website publishes umpire crews each day, but typically late in the morning UK time. Free third-party sites that aggregate ump data and historical zone tendencies are accessible from the UK without a VPN, and most of them update within an hour of the official assignment posting.
What you want to track for any given home-plate ump: career runs per game on his calls, called-strike rate above or below the league baseline, and the over/under split on games he has worked in the past three seasons. Three years is a sensible sample. Less than that and individual-game variance overwhelms the trend; more than that and zone tendencies have shifted enough that older data is misleading.
I cross-reference ump assignment with pitcher matchup and park, in that order. An under-leaning ump in a pitcher-friendly park with two ground-ball starters is the cleanest under setup the league produces. For deeper context on how the park itself amplifies that effect, see my work on pitcher-friendly MLB parks; the umpire and the park stack on each other in measurable ways.
One practical tip – set up a simple morning routine. UK time, around 14:00 to 15:00, is when the day’s home-plate umpire assignments stabilise online. That gives you four to five hours before East Coast first pitch to model the night’s slate. After 17:00 BST, the closing-line move on totals starts to absorb the ump information as US sharp money arrives.
When the umpire edge fades into noise
Not every game has a strong umpire input. Two situations dilute the edge enough that I deliberately skip the ump-driven bet. First, when the starting pitchers are on opposite ends of the run-allowance spectrum – an ace facing a back-end starter – the pitcher mismatch dominates and the umpire’s marginal effect is buried. Second, in games with high projected wind or temperature deviations, the weather effect can override the umpire’s. A tailwind in 90°F dwarfs even a strong under-leaning ump.
The other case is small samples. If an umpire has worked fewer than 50 home-plate games in the relevant window, his profile is noise. New umpires, ump returning from injury, or umps mostly working in second base or first base assignments – none of those produce a reliable enough profile to bet on. Wait until the sample stabilises.
The other discipline check is correlation. The umpire edge correlates with pitcher-handedness, park dimensions, and weather in ways that mean stacking too hard on a single under can mean you are double-counting a single underlying factor. I keep ump-driven unders to a maximum of two per night and never include more than one in a same-game parlay.
What an ump-aware totals book actually looks like
The bettor running an umpire-aware totals book wins on two things – a small set of named umps with deep enough samples to bet, and the discipline to skip every game where the ump signal is buried under stronger inputs. That is roughly 40 to 60 confident under bets across a 162-game schedule. The ROI on that segment, taken as its own track, has historically been the strongest sub-strategy in my MLB book. Not because the umpire signal is huge – it is moderate. Because it persists across years, while the rest of the market moves around it. Persistence at moderate edge, applied with discipline and proper sizing, is the structure of long-term MLB ROI. The umpire is one of the few inputs that delivers it.
Which MLB home-plate umpires have produced under leans?
Did the 2025 ABS challenge change umpire-driven betting edges?
Material created by the team DiamondLines