
How a baseball betting system actually starts
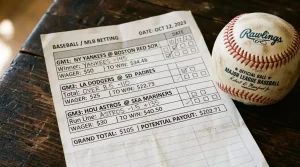
A reader emailed me last May with what he proudly called his MLB betting system. Six paragraphs in, it was a Martingale staircase glued to coin-flip moneylines. That is not a system. That is a slow-motion accident wearing a baseball cap.
I have spent nine years on run-line modelling, NRFI markets, and the way UK books price American baseball against US sharps. A baseball betting system is not a doubling chart. It is a reproducible set of decisions across the three live MLB markets — moneyline, run line, totals — anchored to pitcher data, lineup quality, weather, ballpark, and how the price moves between line origin and first pitch. The numbers either point to a bet or they do not. Any system that promises a progression to bail you out is selling something.
Why this matters for a UK reader: the betting culture you grew up with is built around football accumulators and horse-racing systems. MLB sits in a different universe. When the regulator's chief executive briefed operators in early 2025, his line was direct — there was "a widening out of the sports offering... such as cricket, basketball, NFL and a host of other US-based sports." MLB sits inside that "host of others." The reason it suits a systems approach is structural: 162 regular-season games per club, roughly 15% of US legal handle in 2024, and a daily cadence that hands you a real working sample size while you are still in the same season.
Before mechanics, definitions. The word "system" gets misused so often in this niche that the rest of this guide is useless until we agree on what it actually means.
The pillar in 90 seconds
- A baseball betting system means rules, not progressions. Inputs (pitcher, park, weather, line move) plus a staking discipline plus an audit trail. Anything else is variance dressed as edge.
- MLB plays 2,430 regular-season games every year and pulled 71,409,421 fans into ballparks in 2025. The sample size is the part of the sport you abuse, not fight.
- About 28% of MLB games end on exactly one run, which is why the ±1.5 run line is the most psychology-loaded number on the board.
- UK affordability checks now trigger at £150 net loss inside a 30-day rolling window, and the statutory levy on online operators sits at 1.1% of GGY. Both shape how books price MLB to a UK customer.
- Roughly 3 to 5% of bettors are profitable long term. The split is staking, not picking.
Defining a baseball betting system
Half the people walking into this niche think a "system" is a betting progression they bought on a forum for £29. The other half think it is a list of rules screen-grabbed from an American radio host. Both are wrong, and the confusion costs UK bettors money every season.
A system that survives contact with a real MLB schedule has four parts. Inputs — pitcher metrics, lineup composition, ballpark, weather, line origination, public-bet share. A filter that decides when to bet and, more importantly, when to stand down. A staking rule — flat units or fractional Kelly. And an audit trail, because a system you cannot review backwards is a hobby.
The line between system and progression is clean. A system is right or wrong on the merits of each decision. A progression bets the previous result. Martingale, Fibonacci, and every geometric staircase boil down to "double up after a loss until you win one back." That collapses on the second long losing run, which on MLB will arrive in your first season.
There is academic backing for the approach. A working paper out of East Carolina University on weak-form market efficiency in US sports betting found statistically significant inefficiencies in MLB, NFL, college football, and college basketball — but not NBA or NHL. Of the big four US markets, MLB is the soft one. Pricing inefficiencies are detectable.
An old hand in US baseball handicapping put the operating principle in one line: it is "imperative to search for buy-low opportunities to maximize potential return. Baseball is such a variant driven sport with a lot of randomness involved." The variance does not cancel the system. It is the system's reason to exist.
Three terms a UK bettor must own before reading any further
Handicapping — the analysis you do to estimate the true probability of a sporting outcome and compare it to the price the bookmaker offers.
Juice (or vig) — the bookmaker's built-in margin, the reason 1.91 on each side of a 50/50 is not a fair price.
Expected value (EV) — the average return per pound staked you would expect over many runs of the same bet.
Why MLB suits a systems approach in 2026
Picture the calendar most UK bettors live by. Saturday football, midweek European nights, the Cheltenham build-up in March, a quiet July. Now picture an MLB calendar: 162 regular-season games per club, six clubs typically playing on any given Tuesday, prices and lineups updating into first pitch. The information flow is constant, and that, more than any single edge, is why baseball gives a systems bettor space to actually work.
MLB represented roughly 15% of the United States legal sports-betting handle in 2024 — only the NFL and NBA pull more. US sportsbooks accepted about $149.9 billion in handle and generated $13.78 billion in revenue across all sports. The hold percentage on US sports climbed from 7.01% in 2019 to 9.13% in 2023, mostly because parlays became the default for the casual end. That same growth bankrolls the depth and price-tightness on the singles where actual edges live.
Sample size per season
2,430 regular-season games before postseason, played across roughly six months.
2025 attendance
71,409,421 — third straight year of growth, the first such streak since 2005-2007.
2025 average game time
2 hours 38 minutes — the third straight season at 2:40 or below, last achieved 1983-1985.
2025 broadcast viewership
ESPN Sunday Night Baseball averaged 1.83 million per game (+21% year on year); MLB on FOX averaged 2.04 million (+9%).
2025 streaming volume
MLB.TV consumption hit a record 19.39 billion minutes, up 34% on the year.
For a UK reader, those numbers tell you the live product is being watched on this side of the Atlantic in non-trivial volume — which means UK books are pricing into a market with real liquidity rather than a back-page novelty.

What makes MLB structurally suited to systems work is the daily cadence and the unusually heavy weight of one position. A starting pitcher can change a moneyline by 30 to 40 cents. A weather front can turn a total. A bullpen on its third night of work can flip a late-game live price. None of these are mysteries to American sharps. All of them are still routinely mispriced on UK shopfronts, because the depth of MLB analysis at most UK desks is thinner than at a US trading floor.
The 2025 World Series final game pulled at least 25 million US viewers on Fox, with the seven-game series averaging more than 14 million. That final-game number is roughly the same as a mid-table Premier League weekend's domestic audience. American baseball is not a niche sport; the leakage now reaches the UK in real volume.
The three core MLB markets
The first time I sat next to a UK punter watching an MLB price screen, he stared at +130 on the underdog and asked if it was an each-way figure. Five minutes of explaining American odds versus decimal and he was sorted, but the confusion is structural — and it is the wall a UK bettor has to climb before any system makes sense.
The moneyline asks the simplest question: who wins. The run line is the baseball spread, fixed at ±1.5, and asks whether the favourite covers a one-and-a-half-run handicap. The total — over/under — asks whether the two clubs combine for more or fewer runs than the posted number. A UK shop will normally show all three in decimal odds, with American odds underneath as a courtesy.
Moneyline
- Pick the winner outright.
- Favourites priced below decimal 2.00, dogs above.
- No push possible (extra innings decide it).
- Lowest variance per single bet.
Run line
- Pick a side at -1.5 (favourite) or +1.5 (underdog).
- Always priced near coin-flip on tight matchups.
- Push almost impossible at the standard 1.5.
- Variance higher than moneyline; payouts compensate on the favourite.
Totals (over/under)
- Pick over or under a posted run total (typically 7 to 10.5).
- Heavily moved by pitcher pair, weather, and ballpark.
- Half-run lines avoid push; whole-number totals can.
- Most affected by environmental inputs.
Sample matchup, decimal pricing
Home favourite at -150 American = 1.67 decimal on the moneyline. Same favourite at -1.5 run line might price 2.10 decimal. Total of 8.5 might price 1.91 over and 1.91 under.
Implied probability check: 1/1.67 = 59.9% on the moneyline, 1/2.10 = 47.6% on the run line, 1/1.91 = 52.4% on either side of the total before the book's margin is netted out.
The total's two prices summing to roughly 104.8% reveal the book's hold — about 4.6 percentage points of vig built in.
The single statistic that ties all three markets together is this: about 28% of MLB regular-season games are decided by exactly one run. That structural fact makes the run line behave like a coin flip in tight spots, the moneyline a low-variance sleep-aid in mismatches, and the total the place where weather and bullpens turn modest reads into actual edges.
The three markets do not work in isolation. A read on the total feeds a read on the run line. A read on the moneyline feeds NRFI. The system layer connects markets. The single-bet layer just picks one.
Run line inside a system
I lost a Sunday-night Yankees-Red Sox to -1.5 last August because I trusted the pitching mismatch and ignored the bullpen workload from the previous two nights. The favourite won 4-3. The run line cashed nobody. That is the run line in one sentence — it does not care that you read the matchup correctly, only whether the right side won by two or more.
The mechanics are simple. A favourite at -1.5 must win by at least two runs to cash. An underdog at +1.5 cashes if it wins outright or loses by exactly one. The line never moves to ±2.5 on a standard market because, given that 28% of MLB games end on exactly one run, ±1.5 is already where the bookmaker's edge sits at its sharpest.
When -1.5 is a price worth taking
Step 1. Favourite at decimal 1.55 on the moneyline (American -180). Implied probability 1/1.55 = 64.5%.
Step 2. Same favourite at decimal 2.10 on -1.5. Implied probability 1/2.10 = 47.6%.
Step 3. The market is telling you that of the favourite's 64.5% wins, only 47.6/64.5 = roughly 74% will be by two or more runs.
Step 4. To bet -1.5 with positive EV, your model has to project a higher overall win rate, a higher share of multi-run wins, or both.
Step 5. £100 on -1.5 returns £210 on a cover, loses £100 otherwise. Break-even win rate at this price is 47.6%. Set your bar above that, or skip.
This is also why +1.5 on the underdog is the most popular cushion play in the sport. You buy a one-run fall-back, and you generally pay for it: the +1.5 price typically sits below 2.00 in decimal. A US sportsbook editorial guide framed the choice cleanly last September: "If your read on totals, bullpen edges, and home/road dynamics points to a multi-run outcome, -1.5 can pay you for the bold call; if the matchup screams nail-biter, +1.5 or the moneyline is the smarter lane." Run line is a forecast about how runs are scored. For the full mechanics and a UK pricing breakdown, see the dedicated guide on MLB run line betting.
NRFI and first-inning markets
An NRFI bet is the only single-inning baseball wager I have ever watched a UK punter scream at his television over. The whole thing is decided in roughly twenty minutes — three outs each side — and it lives or dies on whether two starting pitchers can get nine batters through one inning without yielding a run.
The market is short-form, which is why it has become a fixture on UK shopfronts in recent seasons. Books like the simplicity, casual bettors like the immediacy, and a systems player can find a sliver of edge if the inputs are right. The full strategy, including how to combine first-inning ERA with K%, FIP, and lineup-spot data, lives in the dedicated piece on NRFI betting strategy.
What an NRFI actually is
NRFI stands for No Run First Inning. The bet wins if neither team scores in the first inning. YRFI is its mirror — bet that one or both clubs score in the first. The price is set off both starting pitchers' first-inning profiles, the top three batters in each lineup, and any in-game shifts.
The two most common traps: assuming a low season-long ERA means a low first-inning ERA (it often does not), and assuming an ace will dominate a leadoff hitter who has been on base 38% of the time against right-handed pitching this month.
First-inning ERA matters more than full-game ERA because pitchers have a documented tendency to give up runs early before settling — a leadoff hit or four-pitch walk is materially more damaging in inning one than in inning four. Starters with poor first-pitch strike rates end up in the queue of NRFI traps. Lineup-spot quality is the second axis. The top of an order is constructed for on-base ability. If the top three of the visiting club have a combined .350 on-base percentage in the last fortnight, NRFI is a different bet from one priced against a lineup with a .280 OBP top three.
Weather plays a smaller role than people assume on first-inning markets — wind blowing out raises full-game runs by 5.8% in the long sample, but the effect is diluted across nine innings rather than concentrated in one. Use it as a tilt, not a thesis.
Contrarian betting and sharp money
Is fading the public still profitable in 2026? Half my emails ask that. The honest answer: yes, but in narrower spots than the old rule promised. Public money is the casual end. Sharp money is the syndicates and line-origination shops whose stakes move the price rather than respond to it. Reading the split is half the contrarian system. The other half is reverse line movement — the moment a price moves against the side more tickets are on. RLM is the strongest signal a public-data bettor can read.
The numbers that built the contrarian playbook
In a documented 2017 sample, MLB underdogs receiving fewer than 30% of moneyline bets generated a 4.2% ROI when paired with reverse line movement of at least 10 cents.
Across the longer eight-year sample, MLB underdogs receiving under 30% of moneyline bets in heavily-bet games went 2,239-2,873 — a 43.8% win rate — yet returned +193.3 units of profit. The dogs lost more games than they won. Plus-money pricing did the rest.
That second number is the one to internalise. A 43.8% win rate looks like a losing system on a P&L spreadsheet — until you remember the average decimal price on those underdogs sat north of 2.30. The contrarian play does not care about win rate. It cares about EV. A UK bettor coming from football accumulators, where a 70% win rate matters, has to unlearn that instinct on the first MLB dog they back.
The trap is that public-bet percentages alone are no longer enough. Sharp syndicates use the public split as a tell themselves and price into it. The full method now requires line-origination tracking, RLM cross-checks, and a feel for which books move first — see the dedicated piece on contrarian MLB betting.
Starting pitcher as system anchor
I once watched a friend back a road favourite at -135 because the team was in form, then lose ten minutes before first pitch when the listed starter was scratched and a swing-man came up from the bullpen. The line had moved from -135 to -110 in twenty minutes. The market knew. He did not. Pitcher first, everything else second — that is the only system rule I would tattoo on someone.
The starting pitcher is the only player in any team sport who routinely moves a betting line by 30 to 40 cents on his own. Replace him with a long-relief arm and the entire pricing model changes — total goes up, run line tightens, NRFI flips. No striker in the Premier League comes close.
Pitcher metrics that price the bet
ERA — earned run average — is the public's number. It is also the noisy one. Use it for headlines, not for handicapping.
FIP (fielding-independent pitching) strips out everything the pitcher does not control: defensive plays, sequencing luck, BABIP variance. The single most useful talent metric in this niche.
K% (strikeout rate) and BB% (walk rate) are the predictive core. A pitcher who strikes out a quarter of batters faced and walks under 7% has a structural floor; a pitcher at 18% K and 9% BB has a ceiling the moneyline rarely reflects until the third start.
Three-start samples on pitchers are noise; ten-start samples are signal. A starter coming off two ugly outings will be priced as if those outings were predictive. They rarely are. A bettor whose model anchors to underlying metrics — FIP, K-BB%, swinging-strike rate — beats the market reaction often enough to justify the work.
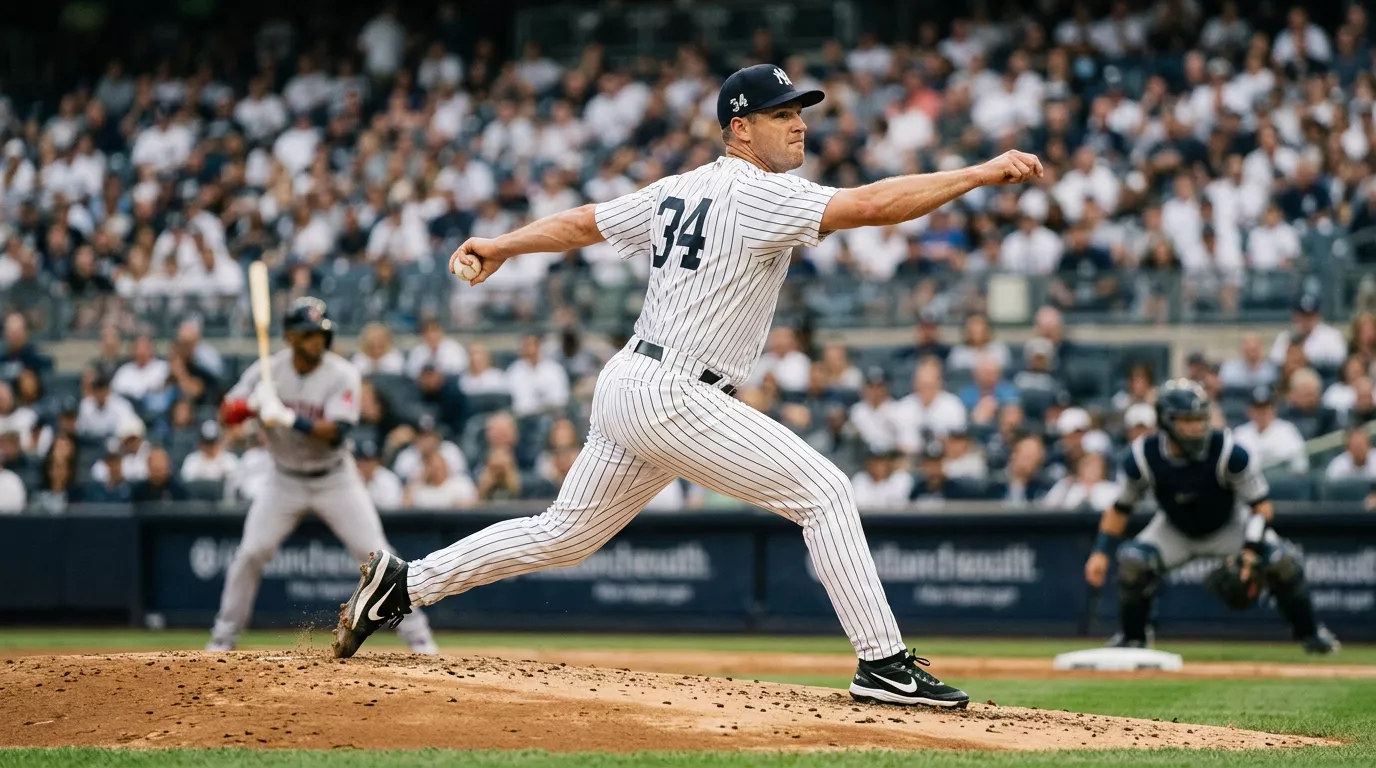
The third-time-through-the-order penalty is the other lever. The same pitcher who looks dominant in innings one through four can fall off a cliff the third time he sees a lineup. A book that hangs a starter at -1.5 deep into a game without accounting for it is offering a play. The full handicapping framework — recent form weighting, when xFIP and SIERA earn their place over FIP, the listed-pitcher-versus-action distinction on a UK shopfront — sits in the dedicated guide on starting pitcher analysis for MLB betting.
Bankroll, Kelly criterion, and variance
I have blown two MLB bankrolls in nine years. Both times the edge was real. Both times the staking was wrong. The first ran into a 14-game losing streak on plus-money underdogs at 8% of bankroll per bet — by game ten my "system" was a pile of broken assumptions. Bankroll discipline is the system. Edge is the variable.
The arithmetic is brutal. At standard -110 American odds (decimal 1.91), a bettor needs a 52.38% win rate just to break even. Roughly 3 to 5% of sports bettors are profitable long term, and the books know it — US sportsbooks retained $13.71 billion from $149.8 billion in handle in 2024, a hold of 9.3%, up from 7.0% in 2019. The hold is the headwind. Bankroll discipline is what lets a real edge cut through it.
The Kelly criterion is the only staking rule that has held up under scrutiny since it was published in 1956. Bet larger when the price gives you more edge, smaller when it gives you less, never so large that a losing run wipes you out.
Kelly stake on a +130 underdog, walked through
Step 1. Decimal odds = 2.30 (American +130). Net odds b = decimal - 1 = 1.30.
Step 2. Your model gives this dog a 50% chance — say a road favourite playing the second leg of a back-to-back against a fresher rotation, with starter values you trust.
Step 3. Kelly fraction f = (b × p - q) / b, where q = 1 - p = 0.50.
Step 4. f = (1.30 × 0.50 - 0.50) / 1.30 = 0.115, or 11.5% of bankroll.
Step 5. On a £500 bankroll, full Kelly is £58. Half Kelly is £29. Quarter Kelly is £14.
Step 6. If your edge calculation is well-calibrated, half is the practical default. Quarter is honest while you build a track record.
The formula assumes you know your true edge precisely. You do not. Most bettors over-estimate edge by 30 to 50% in their first season, which means full Kelly stakes are systematically over-sized. Half Kelly cuts your variance roughly in half while keeping about three-quarters of your long-run growth. Quarter Kelly is the staking rule I would put in the hand of any UK bettor with a sub-£1,000 bankroll.
UK affordability rules add a hard floor — £150 net loss in a 30-day window now triggers a check from the operator. Half-Kelly on a small bankroll naturally keeps stakes inside that threshold, so the maths and the regulator point the same direction. The full method — Kelly on run lines, multi-bet sizing, variance modelling — lives in the deep guide on Kelly criterion for baseball betting.
Weather, parks, and environmental edges
The first time wind cost me a total bet, I was on the under at Wrigley Field on a calm-looking morning in May. By first pitch the flag in centre was straight out — a ten-mile-an-hour gust off the lake had turned around. Three home runs in the first four innings later, I had learned the part of MLB systems no book or guide had bothered to spell out: environmental variables are not a footnote. They are a layer.
The numbers are unambiguous. MLB games with wind blowing out have produced 5.8% more runs and 7.6% more home runs versus neutral or inward wind. A sustained 10-mile-an-hour-plus headwind blowing in can reduce home-run totals by as much as 33%. A baseball hit at 90°F travels 4 to 6 feet farther than the same ball at 50°F — which sounds trivial until you remember that warning-track outs and home runs are routinely separated by exactly that distance.
Going back to 2005, when the wind blows out at 8 mph or more in MLB games, the over has gone 1,174-1,045-125 (52.9%), winning 84.59 units for a 3.6% ROI. A small edge by gambling-system standards. Also a real one — large sample, simple rule, persistent across decades.
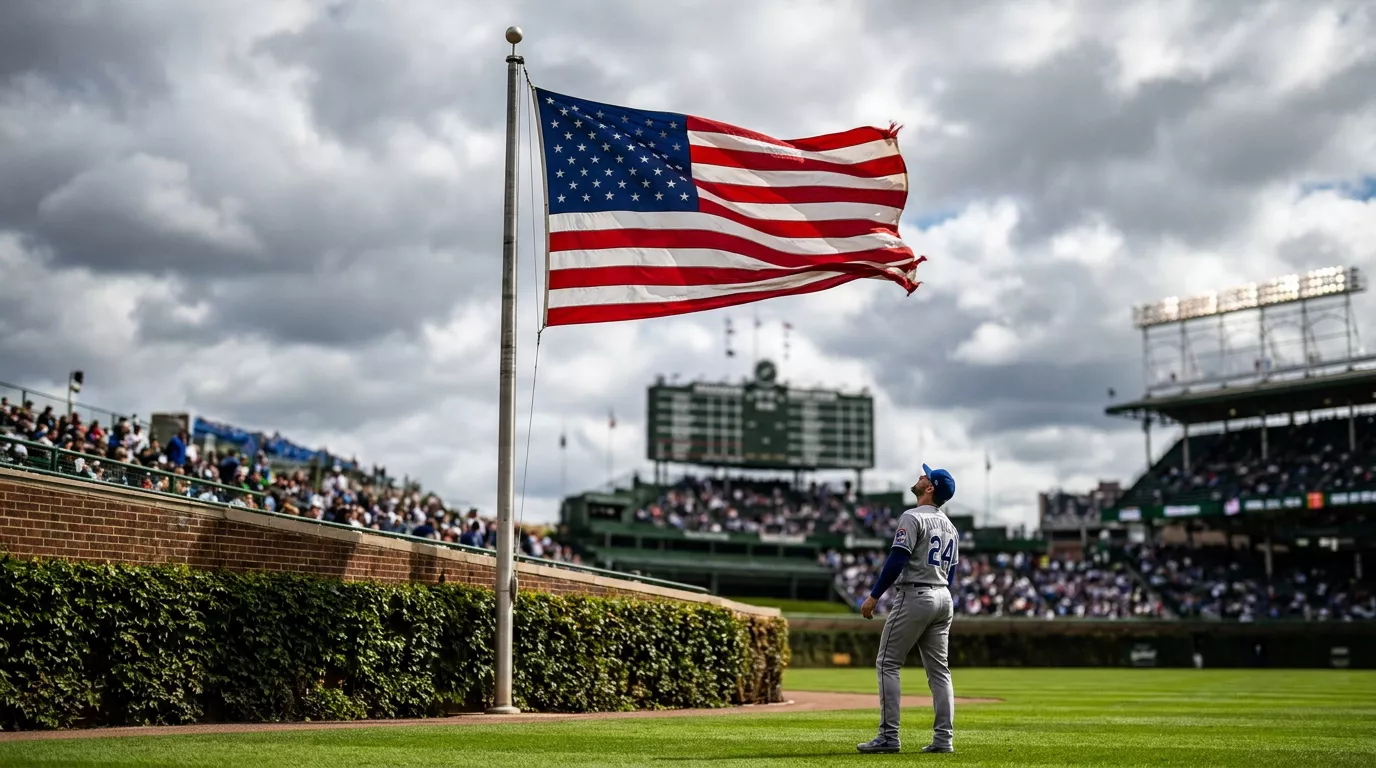
Parks compound the weather effect. Coors Field sits at 5,280 feet; thin air carries the ball roughly 5% farther, which is why every Coors total prices around 11 or 12 and the over still beats the maths-only model. Petco Park cuts the other way — marine layer in the evenings physically grabbing fly balls. Yankee Stadium's short right-field porch turns a 360-foot fly ball into a home run on a left-handed pull hitter.
Build a park-and-weather adjustment into your run total before reading the price. If your model says 8.4 at neutral conditions, and the game is at Coors with a southerly tailwind on a 32°C afternoon, your adjusted projection might be 9.6 and a posted 9.0 is a credible over.
Umpires are the often-ignored fifth variable. The home-plate umpire sets the strike zone, and certain umpires are documented under-the-radar tells: in a Bet Labs sample, when one specific veteran was officiating, MLB unders went 254-190-25 (57.2%), worth +46.75 units and a 10% ROI. A system that ignores the name behind the plate is missing a real edge.
Public systems: Musburger, streaks, and backtests
Brent Musburger had a baseball-betting habit before half the audience reading this had a heartbeat. He still does. The man called college football for forty years and has spent decades cataloguing his own MLB rules — most of them around team momentum and streak behaviour. In 2025 someone bothered to backtest them. The results were not a joke.
Musburger's rule is simple to the point of comedy. Bet teams that have just won three in a row. Fade teams that have just lost three in a row. No filters, no model, no Statcast. The 2025 backtest produced approximately +77.72 units of profit for a $100-per-unit bettor — call it $7,772 of pre-fee profit on a season's worth of action. For a rule that fits on the back of a napkin, that is a number worth pausing on.
When the Sun-Times ran the backtest results past Musburger himself, his reply was a grin in print: "Maybe you want to keep that to yourself. Think about that. As soon as you, well, the FanDuel and DraftKings bookies... you know, we'd better be careful." The joke is also the warning. Public systems with persistent edge attract the trading desks that price the lines, and the edge erodes the moment the rule is famous.
The more interesting half of the backtest was the filter. When the same logic was applied only to a selected six clubs — Cleveland, Miami, Pittsburgh, San Diego, San Francisco, Seattle — the "ride a winner" leg lifted from 21.03 to 39.95 units, and combined season profit climbed to roughly 96.94. Same rule, narrower universe, sample selected for the structural traits that make streak-betting work.
This pattern shows up elsewhere. Across nearly 3,000 MLB games tracked since 2005, betting on a sub-.400 team immediately after it wins one game following a loss has produced more than $19,000 in profit for a $100 bettor and has not had a single losing season. It persists because books trade against the public, public bettors do not back losing teams in volume, and a clean rule that cuts against public preference is structurally protected from price correction.
The lesson is not to copy any public rule wholesale. It is to take the structure — a rule, a filter, a backtest, an audit trail — and build your own.
UK regulatory backdrop for MLB bettors
The first time a UK book asked me for documents to verify affordability, I had been an account holder for eleven years. The request landed between two routine MLB bets, and the deposit pattern that triggered it was unremarkable by any pre-2025 standard. The rules had changed underneath me. They have changed underneath every UK MLB bettor reading this, and a system that does not factor the regulator into its design has a scheduled stop date.
The architecture is now clear. Total Gross Gambling Yield for the customer-facing UK gambling industry reached £16.8 billion in the financial year April 2024 to March 2025, a 7.3% year-on-year increase. Average monthly active online accounts hit 13.5 million. Around 22.5 million consumers gamble in Great Britain regularly — what the Gambling Commission's chief executive called "a significant economic and social activity that people take part in and continues to be a mass participation exercise but one we all know brings its challenges."
Two regulatory shifts matter most for a UK MLB bettor in 2026. The first is the statutory levy. From 6 April 2025, online operators pay 1.1% of GGY into a statutory fund earmarked for research, prevention, and treatment of gambling harms; land-based operators pay 0.5%. The levy will generate roughly £90-£100 million annually by 2027, and operators absorb it into their hold rate.
The second shift is closer to the bone. Light-touch financial vulnerability checks tightened in early 2025: the threshold for affordability action fell to £150 net loss inside a 30-day rolling period from 28 February 2025. £150 net down inside any rolling month, and your operator is contractually obliged to look closer.
Affordability checks are not optional and they are not going away. A bettor running a Kelly-staked MLB system will hit the £150 threshold quickly during a normal variance trough, even with a real long-term edge. Build the regulator into your bankroll plan, not around it.
Before you place an MLB bet from the UK
- Confirm the operator holds a current UKGC licence — verifiable on the public register.
- Set a deposit limit at the account level before you ever fund a bet.
- Track your net 30-day loss in your own audit log, not just the operator's.
- Stage stake size for variance: half-Kelly or quarter-Kelly respects the affordability threshold by design.
- Keep "18+ / BeGambleAware.org" within reach. The phrase is a regulatory nudge, not a slogan.
None of this is a regulatory lecture. It is the operating environment a UK MLB systems bettor is now playing inside. Treat the rules as part of the price.
London Series and the UK MLB audience
I sat at the London Stadium for the 2024 Mets-Phillies series and watched the moment baseball stopped being a niche sport in this country. The crowd around me was overwhelmingly British — first-time attendees, families, kids trying to learn ball-strike rules in real time. I have never seen the cultural conversion happen that fast on a single weekend.
The 2024 London Series produced an estimated $67 million economic boost for London on a fan survey of approximately 6,200 attendees; average attendance was 55,000, with about 71% UK citizens. Three-quarters of the people watching MLB live in London were British, not American tourists. Across all six London games to date, MLB has averaged more than 56,000 fans per game.
The follow-on numbers matter more for a systems bettor. MLB UK social media channels grew 133% year-on-year following the 2023 London Series, and UK MLB merchandise sales rose 43% in the same window. Bookmakers respond to audience size with market depth. Audience growth is the upstream cause of the betting-market depth that has appeared on UK shopfronts.
Bases Covered Live launched on BBC iPlayer in summer 2025 with 11 weekly live games and two postseason doubleheaders — totalling 15 high-profile MLB matchups distributed free to the UK audience. The BBC distribution did for MLB streaming consumption in the UK what Sky originally did for Premier League football: legitimised the product as part of the national sports diet without requiring a sport-specific subscription on day one.
The infrastructure underneath the casual audience is older than most realise. The British Baseball Federation in 2025 ran 57 affiliated clubs and 105 league teams, plus Great Britain national teams at U12, U15, U18, and U23 levels. Not a large playing base by Premier League standards. Large enough to matter, and growing.
For a UK MLB systems bettor, 2026 is the easiest year in living memory to watch the games you bet, get UK-localised commentary, and access the broadcast feeds that drive in-play markets. It is also one of the unsung reasons UK pricing has tightened on MLB markets.

Integrity, prop limits, and the 2025 Guardians case
The 2025 Cleveland Guardians prop case is the moment market integrity stopped being theoretical for UK MLB bettors and became live. A relief pitcher, a teammate, allegations around prop-bet manipulation, and an MLB integrity investigation that ran into the autumn. The case did not change MLB betting overnight, but it changed what every operating book is willing to lay on individual-player props in 2026.
The commissioner's tone in the run-up to the 2025 World Series told you which way the league was leaning. Asked at a Game 2 press scrum about the integrity question, he was blunt about the dependency: "Once you're in that environment where sports betting is happening, the crucial issue is access to data. That means you have to have a relationship with the sportsbooks." The league's mechanism for catching integrity issues runs through the books themselves — flagged unusual stake patterns, prop-market alerts, real-time data exchange.
The same press week, on legalised wagering more broadly: "We didn't ask to have legalized sports betting. It kind of came, and that's the environment in which we operate now." MLB did not seek the betting expansion that has reshaped its commercial environment, but it now treats integrity as the priority that follows.
What changed in practice for a UK MLB bettor: prop-bet limits tightened in late 2025, voiding rules around suspended players became more aggressive, and several UK books quietly reduced individual-pitcher prop limits. Standard markets — moneyline, run line, totals — were not affected.
Build prop exposure carefully. Individual-player props are where book responses to integrity flags will hit hardest. The standard three markets are structurally insulated. A system anchored on moneyline, run line, and totals operates in the part of the MLB market where the rules are least likely to shift mid-season.
Putting your system together
The reader who emailed me last May with the Martingale spreadsheet eventually came back six months later with a different question: how do you actually start. The honest answer was not what he expected. The difference between the 5% who profit and the 95% who do not is not picking. It is staking, audit, and the discipline to skip a card you have no read on.
A baseball betting system is the boring kind of project. You define the rules, backtest them on a slice of the schedule that resembles live conditions, write the audit log into your routine before any stake is placed, and size every bet inside a fractional Kelly that respects both your edge confidence and the UK affordability environment. You skip games you have not handicapped. You walk away from prices within 2-3% of fair.
Do
- Anchor every system to pitcher data first, market data second.
- Stake fractional Kelly — half or quarter — until you have a 200-bet track record.
- Audit every bet inside 24 hours of settlement.
- Build park, weather, and umpire layers into your run-total models.
- Set deposit and loss limits at the operator level before they're ever needed.
Don't
- Bet a Martingale or any geometric progression. It is not a system.
- Chase a moneyline win rate as the headline metric — EV is the only one that pays.
- Bet props in the part of the schedule where book limits are tightening.
- Stake on multiple bets correlated to the same starter.
- Treat affordability checks as an obstacle to work around.
The systems that survive in MLB look unremarkable on paper. A simple rule, a defensible filter, a stake schedule a bored accountant could approve. That is the version of this niche that actually pays UK bettors over a season.
Frequently asked questions
What is the best baseball betting system?
There is no single "best" system. The systems that work in MLB share a structure: a defined input set (pitcher metrics, weather, park, public-bet share, line movement), a filter that selects only the games where those inputs align, a fractional-Kelly stake plan, and an audit log. Public rules like Musburger's three-game streak filter can produce real edge in narrow samples, but erode when widely known. Build your own version, backtest a full season, and stake conservatively.
How do you bet on MLB games from the UK?
Open an account with any UKGC-licensed operator that offers MLB markets — most major UK books now carry moneyline, run line, totals, and a selection of props. Set a deposit limit before funding. Prices are usually shown in decimal odds with American odds as a courtesy. BBC iPlayer's Bases Covered Live runs 11 weekly games and postseason coverage in season; MLB.TV remains the broader subscription option. Affordability checks now trigger at £150 net loss in any 30-day rolling window.
What is a run line in baseball betting?
The run line is the standard MLB spread, fixed at ±1.5. The favourite at -1.5 must win by two runs or more to cash; the underdog at +1.5 cashes if the dog wins outright or loses by exactly one. Because around 28% of MLB games end on exactly one run, the ±1.5 line is structurally close to a coin flip in tight matchups. Take -1.5 when your read points to a multi-run game; take +1.5 when the matchup looks like a one-run nail-biter.
What does NRFI mean in baseball betting?
NRFI stands for No Run First Inning. The bet wins if neither team scores in the first inning. YRFI — Yes Run First Inning — is its mirror. The market is priced off both starting pitchers' first-inning profiles, the top three batters in each lineup, and any pre-game scratches or weather shifts. NRFI is short-form, immediate, and one of the most niche-tradeable single-inning markets a UK book offers.
How does the moneyline work in MLB?
The moneyline is a simple win-or-lose bet on the outright winner, including extra innings. There are no draws. Favourites are priced below decimal 2.00, underdogs above 2.00. Implied probability is 1 divided by the decimal price — so 1.67 implies 59.9%, 2.30 implies 43.5%. The moneyline is the lowest-variance of the three core markets per individual bet, but it pays accordingly.
Is baseball betting profitable in the long run?
For roughly 3 to 5% of bettors, yes. For the other 95%, no. The arithmetic is unforgiving: at decimal 1.91 (-110 American), a bettor needs a 52.38% win rate just to break even on flat stakes, and the average US sportsbook hold has climbed from 7.0% to 9.3% over five years. The bettors who clear the hurdle are not picking better — they are staking better, auditing more honestly, and skipping more cards than they back.
What factors matter most when handicapping an MLB game?
In rough order: starting pitcher quality (FIP, K%, BB%, recent form), bullpen condition and recent workload, top-of-order lineup quality, ballpark factors, weather (wind direction and temperature), and home-plate umpire identity. Public-bet share and reverse line movement give a market read on top of the fundamentals. The starting pitcher carries by far the heaviest weight — a single starter can move a moneyline by 30 to 40 cents on his own.